![]()
Full Monthly Payment
Interest Only
Months
Total Interest Payable
Total Loan Payments
Total Cost
| Year | Interest Paid | Capital Paid | Mortgage Balance |
|---|---|---|---|
| 1 | £14,154.83 | £5,337.34 | £264,662.66 |
| 2 | £13,865.53 | £5,626.63 | £259,036.04 |
| 3 | £13,560.56 | £5,931.60 | £253,104.43 |
| 4 | £13,239.06 | £6,253.10 | £246,851.33 |
| 5 | £12,900.13 | £6,592.03 | £240,259.30 |
| 6 | £12,542.83 | £6,949.33 | £233,309.97 |
| 7 | £12,166.17 | £7,326.00 | £225,983.97 |
| 8 | £11,769.08 | £7,723.08 | £218,260.89 |
| 9 | £11,350.48 | £8,141.68 | £210,119.21 |
| 10 | £10,909.19 | £8,582.97 | £201,536.24 |
| 11 | £10,443.98 | £9,048.18 | £192,488.06 |
| 12 | £9,953.55 | £9,538.61 | £182,949.44 |
| 13 | £9,436.54 | £10,055.62 | £172,893.83 |
| 14 | £8,891.51 | £10,600.65 | £162,293.18 |
| 15 | £8,316.94 | £11,175.22 | £151,117.95 |
| 16 | £7,711.22 | £11,780.94 | £139,337.01 |
| 17 | £7,072.68 | £12,419.48 | £126,917.53 |
| 18 | £6,399.52 | £13,092.64 | £113,824.89 |
| 19 | £5,689.88 | £13,802.28 | £100,022.61 |
| 20 | £4,941.77 | £14,550.39 | £85,472.22 |
| 21 | £4,153.12 | £15,339.04 | £70,133.17 |
| 22 | £3,321.72 | £16,170.45 | £53,962.72 |
| 23 | £2,445.25 | £17,046.91 | £36,915.81 |
| 24 | £1,521.28 | £17,970.88 | £18,944.93 |
| 25 | £547.23 | £18,944.93 | £-0.00 |
| Month | Interest Paid | Capital Paid | Mortgage Balance |
|---|---|---|---|
| 1 | £1,190.25 | £434.10 | £269,565.90 |
| 2 | £1,188.34 | £436.01 | £269,129.89 |
| 3 | £1,186.41 | £437.93 | £268,691.96 |
| 4 | £1,184.48 | £439.86 | £268,252.10 |
| 5 | £1,182.54 | £441.80 | £267,810.30 |
| 6 | £1,180.60 | £443.75 | £267,366.55 |
| 7 | £1,178.64 | £445.71 | £266,920.84 |
| 8 | £1,176.68 | £447.67 | £266,473.17 |
| 9 | £1,174.70 | £449.64 | £266,023.52 |
| 10 | £1,172.72 | £451.63 | £265,571.90 |
| 11 | £1,170.73 | £453.62 | £265,118.28 |
| 12 | £1,168.73 | £455.62 | £264,662.66 |
| 13 | £1,166.72 | £457.63 | £264,205.04 |
| 14 | £1,164.70 | £459.64 | £263,745.40 |
| 15 | £1,162.68 | £461.67 | £263,283.73 |
| 16 | £1,160.64 | £463.70 | £262,820.02 |
| 17 | £1,158.60 | £465.75 | £262,354.27 |
| 18 | £1,156.55 | £467.80 | £261,886.47 |
| 19 | £1,154.48 | £469.86 | £261,416.61 |
| 20 | £1,152.41 | £471.94 | £260,944.67 |
| 21 | £1,150.33 | £474.02 | £260,470.66 |
| 22 | £1,148.24 | £476.11 | £259,994.55 |
| 23 | £1,146.14 | £478.20 | £259,516.35 |
| 24 | £1,144.03 | £480.31 | £259,036.04 |
| 25 | £1,141.92 | £482.43 | £258,553.61 |
| 26 | £1,139.79 | £484.56 | £258,069.05 |
| 27 | £1,137.65 | £486.69 | £257,582.36 |
| 28 | £1,135.51 | £488.84 | £257,093.52 |
| 29 | £1,133.35 | £490.99 | £256,602.53 |
| 30 | £1,131.19 | £493.16 | £256,109.37 |
| 31 | £1,129.02 | £495.33 | £255,614.04 |
| 32 | £1,126.83 | £497.51 | £255,116.52 |
| 33 | £1,124.64 | £499.71 | £254,616.81 |
| 34 | £1,122.44 | £501.91 | £254,114.90 |
| 35 | £1,120.22 | £504.12 | £253,610.78 |
| 36 | £1,118.00 | £506.35 | £253,104.43 |
| 37 | £1,115.77 | £508.58 | £252,595.86 |
| 38 | £1,113.53 | £510.82 | £252,085.04 |
| 39 | £1,111.27 | £513.07 | £251,571.96 |
| 40 | £1,109.01 | £515.33 | £251,056.63 |
| 41 | £1,106.74 | £517.61 | £250,539.02 |
| 42 | £1,104.46 | £519.89 | £250,019.14 |
| 43 | £1,102.17 | £522.18 | £249,496.96 |
| 44 | £1,099.87 | £524.48 | £248,972.48 |
| 45 | £1,097.55 | £526.79 | £248,445.68 |
| 46 | £1,095.23 | £529.12 | £247,916.57 |
| 47 | £1,092.90 | £531.45 | £247,385.12 |
| 48 | £1,090.56 | £533.79 | £246,851.33 |
| 49 | £1,088.20 | £536.14 | £246,315.19 |
| 50 | £1,085.84 | £538.51 | £245,776.68 |
| 51 | £1,083.47 | £540.88 | £245,235.80 |
| 52 | £1,081.08 | £543.27 | £244,692.53 |
| 53 | £1,078.69 | £545.66 | £244,146.87 |
| 54 | £1,076.28 | £548.07 | £243,598.81 |
| 55 | £1,073.86 | £550.48 | £243,048.32 |
| 56 | £1,071.44 | £552.91 | £242,495.41 |
| 57 | £1,069.00 | £555.35 | £241,940.07 |
| 58 | £1,066.55 | £557.79 | £241,382.27 |
| 59 | £1,064.09 | £560.25 | £240,822.02 |
| 60 | £1,061.62 | £562.72 | £240,259.30 |
| 61 | £1,059.14 | £565.20 | £239,694.09 |
| 62 | £1,056.65 | £567.70 | £239,126.40 |
| 63 | £1,054.15 | £570.20 | £238,556.20 |
| 64 | £1,051.64 | £572.71 | £237,983.49 |
| 65 | £1,049.11 | £575.24 | £237,408.25 |
| 66 | £1,046.57 | £577.77 | £236,830.48 |
| 67 | £1,044.03 | £580.32 | £236,250.16 |
| 68 | £1,041.47 | £582.88 | £235,667.29 |
| 69 | £1,038.90 | £585.45 | £235,081.84 |
| 70 | £1,036.32 | £588.03 | £234,493.81 |
| 71 | £1,033.73 | £590.62 | £233,903.19 |
| 72 | £1,031.12 | £593.22 | £233,309.97 |
| 73 | £1,028.51 | £595.84 | £232,714.13 |
| 74 | £1,025.88 | £598.47 | £232,115.66 |
| 75 | £1,023.24 | £601.10 | £231,514.56 |
| 76 | £1,020.59 | £603.75 | £230,910.81 |
| 77 | £1,017.93 | £606.41 | £230,304.39 |
| 78 | £1,015.26 | £609.09 | £229,695.30 |
| 79 | £1,012.57 | £611.77 | £229,083.53 |
| 80 | £1,009.88 | £614.47 | £228,469.06 |
| 81 | £1,007.17 | £617.18 | £227,851.88 |
| 82 | £1,004.45 | £619.90 | £227,231.98 |
| 83 | £1,001.71 | £622.63 | £226,609.35 |
| 84 | £998.97 | £625.38 | £225,983.97 |
| 85 | £996.21 | £628.13 | £225,355.84 |
| 86 | £993.44 | £630.90 | £224,724.93 |
| 87 | £990.66 | £633.68 | £224,091.25 |
| 88 | £987.87 | £636.48 | £223,454.77 |
| 89 | £985.06 | £639.28 | £222,815.49 |
| 90 | £982.24 | £642.10 | £222,173.39 |
| 91 | £979.41 | £644.93 | £221,528.45 |
| 92 | £976.57 | £647.78 | £220,880.68 |
| 93 | £973.72 | £650.63 | £220,230.05 |
| 94 | £970.85 | £653.50 | £219,576.55 |
| 95 | £967.97 | £656.38 | £218,920.17 |
| 96 | £965.07 | £659.27 | £218,260.89 |
| 97 | £962.17 | £662.18 | £217,598.71 |
| 98 | £959.25 | £665.10 | £216,933.61 |
| 99 | £956.32 | £668.03 | £216,265.58 |
| 100 | £953.37 | £670.98 | £215,594.61 |
| 101 | £950.41 | £673.93 | £214,920.67 |
| 102 | £947.44 | £676.90 | £214,243.77 |
| 103 | £944.46 | £679.89 | £213,563.88 |
| 104 | £941.46 | £682.89 | £212,880.99 |
| 105 | £938.45 | £685.90 | £212,195.10 |
| 106 | £935.43 | £688.92 | £211,506.18 |
| 107 | £932.39 | £691.96 | £210,814.22 |
| 108 | £929.34 | £695.01 | £210,119.21 |
| 109 | £926.28 | £698.07 | £209,421.14 |
| 110 | £923.20 | £701.15 | £208,719.99 |
| 111 | £920.11 | £704.24 | £208,015.75 |
| 112 | £917.00 | £707.34 | £207,308.41 |
| 113 | £913.88 | £710.46 | £206,597.95 |
| 114 | £910.75 | £713.59 | £205,884.35 |
| 115 | £907.61 | £716.74 | £205,167.61 |
| 116 | £904.45 | £719.90 | £204,447.71 |
| 117 | £901.27 | £723.07 | £203,724.64 |
| 118 | £898.09 | £726.26 | £202,998.38 |
| 119 | £894.88 | £729.46 | £202,268.92 |
| 120 | £891.67 | £732.68 | £201,536.24 |
| 121 | £888.44 | £735.91 | £200,800.33 |
| 122 | £885.19 | £739.15 | £200,061.18 |
| 123 | £881.94 | £742.41 | £199,318.77 |
| 124 | £878.66 | £745.68 | £198,573.09 |
| 125 | £875.38 | £748.97 | £197,824.12 |
| 126 | £872.07 | £752.27 | £197,071.84 |
| 127 | £868.76 | £755.59 | £196,316.26 |
| 128 | £865.43 | £758.92 | £195,557.34 |
| 129 | £862.08 | £762.26 | £194,795.07 |
| 130 | £858.72 | £765.63 | £194,029.45 |
| 131 | £855.35 | £769.00 | £193,260.45 |
| 132 | £851.96 | £772.39 | £192,488.06 |
| 133 | £848.55 | £775.80 | £191,712.26 |
| 134 | £845.13 | £779.22 | £190,933.04 |
| 135 | £841.70 | £782.65 | £190,150.39 |
| 136 | £838.25 | £786.10 | £189,364.29 |
| 137 | £834.78 | £789.57 | £188,574.73 |
| 138 | £831.30 | £793.05 | £187,781.68 |
| 139 | £827.80 | £796.54 | £186,985.14 |
| 140 | £824.29 | £800.05 | £186,185.09 |
| 141 | £820.77 | £803.58 | £185,381.50 |
| 142 | £817.22 | £807.12 | £184,574.38 |
| 143 | £813.67 | £810.68 | £183,763.70 |
| 144 | £810.09 | £814.26 | £182,949.44 |
| 145 | £806.50 | £817.84 | £182,131.60 |
| 146 | £802.90 | £821.45 | £181,310.15 |
| 147 | £799.28 | £825.07 | £180,485.08 |
| 148 | £795.64 | £828.71 | £179,656.37 |
| 149 | £791.99 | £832.36 | £178,824.01 |
| 150 | £788.32 | £836.03 | £177,987.98 |
| 151 | £784.63 | £839.72 | £177,148.26 |
| 152 | £780.93 | £843.42 | £176,304.84 |
| 153 | £777.21 | £847.14 | £175,457.71 |
| 154 | £773.48 | £850.87 | £174,606.84 |
| 155 | £769.73 | £854.62 | £173,752.21 |
| 156 | £765.96 | £858.39 | £172,893.83 |
| 157 | £762.17 | £862.17 | £172,031.65 |
| 158 | £758.37 | £865.97 | £171,165.68 |
| 159 | £754.56 | £869.79 | £170,295.89 |
| 160 | £750.72 | £873.63 | £169,422.26 |
| 161 | £746.87 | £877.48 | £168,544.78 |
| 162 | £743.00 | £881.35 | £167,663.44 |
| 163 | £739.12 | £885.23 | £166,778.21 |
| 164 | £735.21 | £889.13 | £165,889.08 |
| 165 | £731.29 | £893.05 | £164,996.02 |
| 166 | £727.36 | £896.99 | £164,099.03 |
| 167 | £723.40 | £900.94 | £163,198.09 |
| 168 | £719.43 | £904.92 | £162,293.18 |
| 169 | £715.44 | £908.90 | £161,384.27 |
| 170 | £711.44 | £912.91 | £160,471.36 |
| 171 | £707.41 | £916.94 | £159,554.42 |
| 172 | £703.37 | £920.98 | £158,633.45 |
| 173 | £699.31 | £925.04 | £157,708.41 |
| 174 | £695.23 | £929.12 | £156,779.29 |
| 175 | £691.14 | £933.21 | £155,846.08 |
| 176 | £687.02 | £937.33 | £154,908.76 |
| 177 | £682.89 | £941.46 | £153,967.30 |
| 178 | £678.74 | £945.61 | £153,021.69 |
| 179 | £674.57 | £949.78 | £152,071.92 |
| 180 | £670.38 | £953.96 | £151,117.95 |
| 181 | £666.18 | £958.17 | £150,159.78 |
| 182 | £661.95 | £962.39 | £149,197.39 |
| 183 | £657.71 | £966.63 | £148,230.76 |
| 184 | £653.45 | £970.90 | £147,259.86 |
| 185 | £649.17 | £975.18 | £146,284.68 |
| 186 | £644.87 | £979.48 | £145,305.21 |
| 187 | £640.55 | £983.79 | £144,321.42 |
| 188 | £636.22 | £988.13 | £143,333.29 |
| 189 | £631.86 | £992.49 | £142,340.80 |
| 190 | £627.49 | £996.86 | £141,343.94 |
| 191 | £623.09 | £1,001.26 | £140,342.68 |
| 192 | £618.68 | £1,005.67 | £139,337.01 |
| 193 | £614.24 | £1,010.10 | £138,326.91 |
| 194 | £609.79 | £1,014.56 | £137,312.36 |
| 195 | £605.32 | £1,019.03 | £136,293.33 |
| 196 | £600.83 | £1,023.52 | £135,269.81 |
| 197 | £596.31 | £1,028.03 | £134,241.78 |
| 198 | £591.78 | £1,032.56 | £133,209.21 |
| 199 | £587.23 | £1,037.12 | £132,172.09 |
| 200 | £582.66 | £1,041.69 | £131,130.41 |
| 201 | £578.07 | £1,046.28 | £130,084.13 |
| 202 | £573.45 | £1,050.89 | £129,033.23 |
| 203 | £568.82 | £1,055.53 | £127,977.71 |
| 204 | £564.17 | £1,060.18 | £126,917.53 |
| 205 | £559.49 | £1,064.85 | £125,852.68 |
| 206 | £554.80 | £1,069.55 | £124,783.13 |
| 207 | £550.09 | £1,074.26 | £123,708.87 |
| 208 | £545.35 | £1,079.00 | £122,629.87 |
| 209 | £540.59 | £1,083.75 | £121,546.12 |
| 210 | £535.82 | £1,088.53 | £120,457.59 |
| 211 | £531.02 | £1,093.33 | £119,364.26 |
| 212 | £526.20 | £1,098.15 | £118,266.11 |
| 213 | £521.36 | £1,102.99 | £117,163.12 |
| 214 | £516.49 | £1,107.85 | £116,055.27 |
| 215 | £511.61 | £1,112.74 | £114,942.53 |
| 216 | £506.70 | £1,117.64 | £113,824.89 |
| 217 | £501.78 | £1,122.57 | £112,702.32 |
| 218 | £496.83 | £1,127.52 | £111,574.80 |
| 219 | £491.86 | £1,132.49 | £110,442.32 |
| 220 | £486.87 | £1,137.48 | £109,304.83 |
| 221 | £481.85 | £1,142.49 | £108,162.34 |
| 222 | £476.82 | £1,147.53 | £107,014.81 |
| 223 | £471.76 | £1,152.59 | £105,862.22 |
| 224 | £466.68 | £1,157.67 | £104,704.55 |
| 225 | £461.57 | £1,162.77 | £103,541.77 |
| 226 | £456.45 | £1,167.90 | £102,373.87 |
| 227 | £451.30 | £1,173.05 | £101,200.83 |
| 228 | £446.13 | £1,178.22 | £100,022.61 |
| 229 | £440.93 | £1,183.41 | £98,839.19 |
| 230 | £435.72 | £1,188.63 | £97,650.56 |
| 231 | £430.48 | £1,193.87 | £96,456.69 |
| 232 | £425.21 | £1,199.13 | £95,257.56 |
| 233 | £419.93 | £1,204.42 | £94,053.14 |
| 234 | £414.62 | £1,209.73 | £92,843.41 |
| 235 | £409.28 | £1,215.06 | £91,628.35 |
| 236 | £403.93 | £1,220.42 | £90,407.93 |
| 237 | £398.55 | £1,225.80 | £89,182.13 |
| 238 | £393.14 | £1,231.20 | £87,950.93 |
| 239 | £387.72 | £1,236.63 | £86,714.30 |
| 240 | £382.27 | £1,242.08 | £85,472.22 |
| 241 | £376.79 | £1,247.56 | £84,224.66 |
| 242 | £371.29 | £1,253.06 | £82,971.60 |
| 243 | £365.77 | £1,258.58 | £81,713.02 |
| 244 | £360.22 | £1,264.13 | £80,448.89 |
| 245 | £354.65 | £1,269.70 | £79,179.19 |
| 246 | £349.05 | £1,275.30 | £77,903.89 |
| 247 | £343.43 | £1,280.92 | £76,622.97 |
| 248 | £337.78 | £1,286.57 | £75,336.41 |
| 249 | £332.11 | £1,292.24 | £74,044.17 |
| 250 | £326.41 | £1,297.94 | £72,746.23 |
| 251 | £320.69 | £1,303.66 | £71,442.58 |
| 252 | £314.94 | £1,309.40 | £70,133.17 |
| 253 | £309.17 | £1,315.18 | £68,817.99 |
| 254 | £303.37 | £1,320.97 | £67,497.02 |
| 255 | £297.55 | £1,326.80 | £66,170.22 |
| 256 | £291.70 | £1,332.65 | £64,837.58 |
| 257 | £285.83 | £1,338.52 | £63,499.06 |
| 258 | £279.93 | £1,344.42 | £62,154.63 |
| 259 | £274.00 | £1,350.35 | £60,804.29 |
| 260 | £268.05 | £1,356.30 | £59,447.98 |
| 261 | £262.07 | £1,362.28 | £58,085.70 |
| 262 | £256.06 | £1,368.29 | £56,717.42 |
| 263 | £250.03 | £1,374.32 | £55,343.10 |
| 264 | £243.97 | £1,380.38 | £53,962.72 |
| 265 | £237.89 | £1,386.46 | £52,576.26 |
| 266 | £231.77 | £1,392.57 | £51,183.69 |
| 267 | £225.63 | £1,398.71 | £49,784.98 |
| 268 | £219.47 | £1,404.88 | £48,380.10 |
| 269 | £213.28 | £1,411.07 | £46,969.03 |
| 270 | £207.06 | £1,417.29 | £45,551.74 |
| 271 | £200.81 | £1,423.54 | £44,128.20 |
| 272 | £194.53 | £1,429.81 | £42,698.38 |
| 273 | £188.23 | £1,436.12 | £41,262.27 |
| 274 | £181.90 | £1,442.45 | £39,819.82 |
| 275 | £175.54 | £1,448.81 | £38,371.01 |
| 276 | £169.15 | £1,455.19 | £36,915.81 |
| 277 | £162.74 | £1,461.61 | £35,454.20 |
| 278 | £156.29 | £1,468.05 | £33,986.15 |
| 279 | £149.82 | £1,474.52 | £32,511.63 |
| 280 | £143.32 | £1,481.02 | £31,030.60 |
| 281 | £136.79 | £1,487.55 | £29,543.05 |
| 282 | £130.24 | £1,494.11 | £28,048.94 |
| 283 | £123.65 | £1,500.70 | £26,548.24 |
| 284 | £117.03 | £1,507.31 | £25,040.93 |
| 285 | £110.39 | £1,513.96 | £23,526.97 |
| 286 | £103.71 | £1,520.63 | £22,006.34 |
| 287 | £97.01 | £1,527.34 | £20,479.00 |
| 288 | £90.28 | £1,534.07 | £18,944.93 |
| 289 | £83.52 | £1,540.83 | £17,404.10 |
| 290 | £76.72 | £1,547.62 | £15,856.48 |
| 291 | £69.90 | £1,554.45 | £14,302.03 |
| 292 | £63.05 | £1,561.30 | £12,740.73 |
| 293 | £56.17 | £1,568.18 | £11,172.55 |
| 294 | £49.25 | £1,575.09 | £9,597.46 |
| 295 | £42.31 | £1,582.04 | £8,015.42 |
| 296 | £35.33 | £1,589.01 | £6,426.41 |
| 297 | £28.33 | £1,596.02 | £4,830.39 |
| 298 | £21.29 | £1,603.05 | £3,227.34 |
| 299 | £14.23 | £1,610.12 | £1,617.22 |
| 300 | £7.13 | £1,617.22 | £-0.00 |
An Introduction to the UK Mortgage Market
How Big is the UK Mortgage Market?
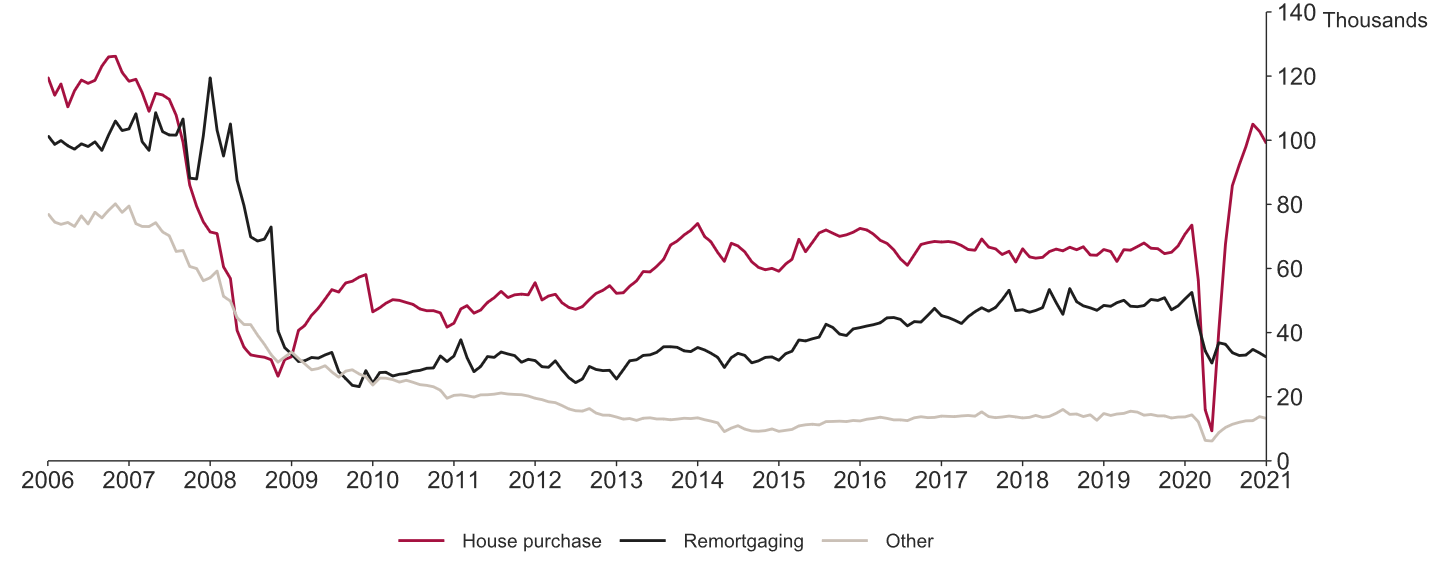
Historically across the United Kingdom, around 65 thousand to 70 thousand mortgages are approved each month. This is from a low of around 30 thousand after the 2008 to 2009 global financial crisis. Prior to the recession, the monthly rate was closer to 80 thousand to 130 thousand mortgages completed each month.
The UK Mortgage Market is Over £1.5 Trillion
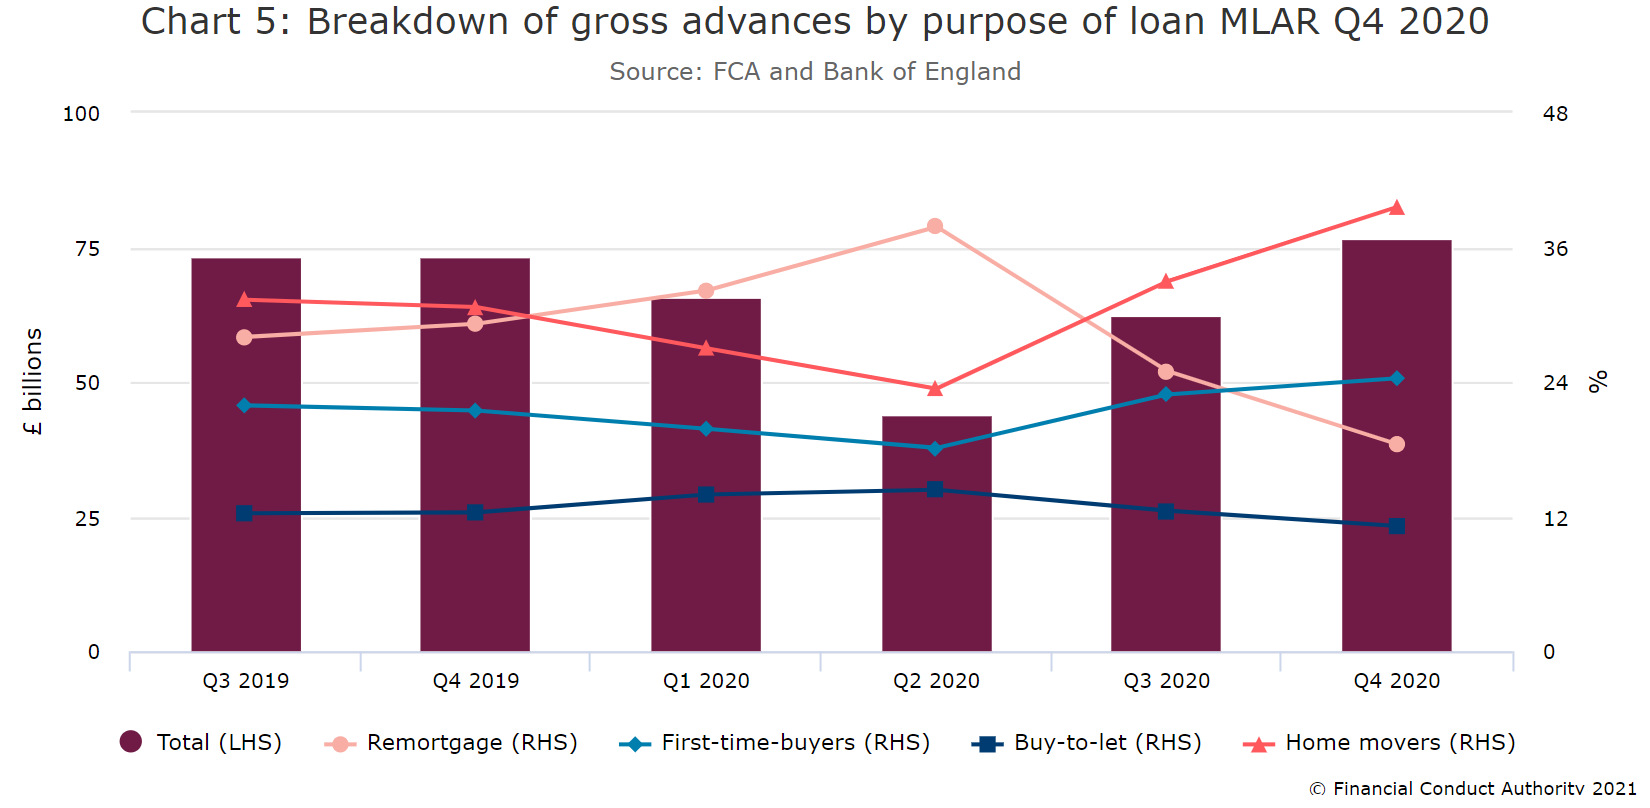
In the fourth quarter of 2020, there were £76.5 billion new mortgage originations in the UK, according to the Financial Conduct Authority (FCA). At the end of the fourth quarter of 2020, there were £1,438.4 billion in unsecuritised home loans outstanding, with £102.956 billion in securitised home loans. Total residential mortgages to individuals summed of £1.541 trillion across 13,404,487 loans in the fourth quarter of 2020.
Overall mortgage debt tends to grow around 3% to 6% per annum, though there can be significant fluctuations in that rate of growth due to factors like BREXIT, the global economic crisis which happened in 2008, COVID-19 lockdowns, etc. Segments of the market can change faster than the overall market due to those same sorts of factors along with various legal changes tied to foreign property ownership, the localised balance between immigration and construction, etc.
Market Composition
In the fourth quarter of 2020, 75.8% of gross advances were made for home purchases, while 18.45% of the market was for remortgages. Future advances and the other category round out the market at about 3% each. Breaking down the home purchase figures further, 23.32% were loans to first-time homebuyers, 11.15% were for buy-to-let mortgages, and 39.60% was classified as other.
Looking at new commitments, 71.81% were for home purchases, while 23.59% were for remortgages. The other category, including further advances, comprised 4.60% of new commitments.
Over the past couple of years, 76% to 78% of advances were for capital and interest repayment loans. Meanwhile, 17% to 20% were for interest-only payment loans, and 4% to 6% were structured as combined or other. Regulated loans tend to lean much more heavily toward the capital and interest repayment structure, while non-regulated loans are far more likely to be structured as interest-only deals.
In 2020, when the COVID-19 crisis swept across the globe, economies were forced to slow down. In response, central banks intervened to reduce interest rates and further add liquidity to the market. When interest rates fall, the composition of the United States housing market tends to shift heavily toward refinancing (remortgaging). This is because fixed-rate mortgages in the U.S. are locked for the entire duration of the loan term.
In contrast, the UK market share between purchase and remortgages is much more stable, as fixed-rate mortgages adjust with market conditions after the introductory period. Over the past 3 years, remortgaging has made up between 27.49% to 37.83% of the UK market. The peak came in the second quarter of 2020, after interest rates cratered in response to the COVID-19 crisis. In the fourth quarter of 2020, 18.45% of residential loans to individuals were remortgages.
Fixed & Variable Rates
The standard variable rate (SVR) is the basic interest rate lenders use for mortgages. Each lender sets their default SVR. It’s the default rate mortgages revert to after the introductory period of a loan, which is usually 2 to 5 years. SVR mortgages usually have higher interest rates than other mortgage options.
Standard variable rates move based on fluctuations in the Bank of England base rate. When rates reset higher, borrowers must be prepared to make higher monthly payments. To avoid reverting to the SVR, borrowers would remortgage to a new deal with a favourable rate.
In recent years, standard variable rates have been on the rise. Because of this, many consumers find fixed-rate mortgage options more attractive. According to the Bank of England, since 2016, fixed-rate options are more preferred by borrowers, especially first-time homebuyers.
In the third quarter of 2020, 91.2% of all mortgages used fixed-rate loans. The average fixed-rate mortgage was priced at 1.91%. In contrast, the average variable rate mortgage was priced at 1.85%, bringing the overall market average to 1.91%.
What is a “Fixed” Rate?
The phrase “fixed rates” has a different meaning depending on the real estate market. In most markets around the world, mortgages are usually variable rate loans. Variable rate mortgages are only fixed for a limited period of time at the beginning of the loan term.
The only major exception to this rule of thumb is the United States market. In the U.S., the federal government heavily subsidises the housing market through GSEs, Fannie Mae and Freddie Mac. U.S. homebuyers have the ability to lock in a fixed rate for up to 30 years. The U.S. government backs Fannie Mae and Freddie Mac purchases of mortgage securities. With strong government-backing, over 90% of U.S. borrowers opt for fixed-rate loans.
The UK government provides subsidy programs in Help to Buy and Help to Buy London. These government schemes offer mortgage deposit assistance. However, few lenders in the UK provide loans which have fixed rates extending beyond 5 years.

Which Loans Structures Do Most Buyers Prefer?
Most lenders across the UK will guarantee fixed rates for 2 to 5 years. They structure the remaining loan term with a floating variable rate, which tracks the base rate from the Bank of England. The initial fixed-rate period of the loan often comes at a deal rate which has a lower spread. If market rates move higher when rates reset, it can cause a large increase in monthly payments.
For example, if one owed £180,000 and their rate went from 2.29% to 3.29%, an interest-only payment would jump from £343.50 to £493.50. Meanwhile, a full monthly payment would jump from £788.61 to £880.98.
1
About 92% of borrowers opt for fixed rate mortgages in the UK.
2
58% of borrowers choose a 2-year deal period, while 32% opt for a 5-year deal period.
3
Only 1 in 50 mortgages come with a fixed rate longer than 5 years.
4
Many loans with a longer fixed period come with significantly higher rates, and onerous early repayment charges.
Unsure how your payments may change as rates rise and fall? We provide a UK mortgage amortisation calculator. This allows you to see how changing rates can impact your monthly payments. You can compare interest-only payments and fixed-rate loans side by side. It also generates a printable amortisation schedule of your monthly mortgage payments.
During the introductory period, some banks may limit how much of the loan you can overpay. Meanwhile, lenders allow higher overpayments after the introductory period, when the rate has reverted to the standard variable rate (SVR).
Many borrowers across the UK remortgage their loans when rates reset. This is a big part of why remortgages were nearly 40% of new commitments in 2020. In response to the COVID-19 crisis, when the Bank of England dropped its base rate to 0.1% in March 2020, it helped stimulate market activity and growth. To date, it’s the lowest base rate in the Bank of England’s 325-year history.
A lot of mortgages contain upfront fees that help cover administrative expenses and the cost of offering lower rates. Some loan terms also prohibit borrowers from making advanced payments, particularly in the introductory fixed-rate period.
Loan Deposit and Credit Records
Most borrowers that qualify for financing save substantial funds for deposit. They also have a good credit history showing on-time payments without large outstanding balances. In the fourth quarter of 2020, only 0.37% of mortgages from borrowers with impaired credit history were approved by lenders.
What is Loan-to-value Ratio?
1
LTV stands for loan-to-value. It’s a ratio that compares the size of the loan against the value of the dwelling.
2
For example, if you saved a £50,000 deposit for a £200,000 home, your loan amount would be £150,000. To calculate the LTV ratio, divide £150,000 by £200,000. In this example, the LTV ratio is 75%.
3
In the fourth quarter of 2020, a tiny 0.16% of gross advances went to loans with an LTV over 95%. Meanwhile, 1.06% went to loans with an LTV between 90% and 95%. An estimated 38.76% of advances were granted to loans between 75% and 90% LTV, while 60.02% of gross advances went to loans with an LTV below 75%.
4
Lenders prefer to extend credit to borrowers with relatively low LTV values. If a borrower obtained funding at 100% LTV, any weakness in the local property market could expose the lender to outright potential losses. For this reason, borrowers in the highest LTV quartile may pay 1% APR higher than borrowers in the lower half of the market.
Mortgage Affordability
Baseline Limit
As a baseline, most lenders typically do not lend more than 4.5 times the borrower’s annual income. For example, if you make £50,000 a year, a lender might be willing to grant a loan amount between £150,000 and £225,000. For joint applicants, the limit is usually slightly lower. A lender might offer a full multiple on the first income and then add the second income, or they lower the multiplier across incomes down to 3. Examples are shown in the table below:
| Income 1 | Income 2 | Multiple | Amount |
|---|---|---|---|
| £50,000 | £0 | 4.5x | £225,000 |
| £30,000 | £20,000 | 3x both | £150,000 |
| £30,000 | £20,000 | 3x first plus second | £110,000 |
In rare cases, lenders may loan up to 5 times the borrower’s annual salary. However, regulatory restrictions limit banks to having no more than 15% of their mortgage loans above the 4.5x multiple. In these cases, lenders can be selective and only choose borrowers with low debt loads that can afford a substantial deposit.
Moreover, lenders review a borrower’s debt load and monthly outgoings. This presumes borrowers spend about 3% to 5% of their debt amount on monthly debt service payments when lenders perform calculations.
Use our mortgage affordability qualification calculator to estimate how much you can qualify for based on your current income.
Bank of England Limitations
In the wake of the 2008 - 2009 financial crisis the Bank of England implemented mortgage affordability testing rules which aimed to stop banks from offering risky loans where the borrower would be unable to repay the reversion rate on the loan if the rate increased by 3%.
In June of 2022 the Bank of England pressed ahead with plans to scrap this mortgage affordability test, though borrowers who are stretched should consider what happens to their finances if rates rise.
General Affordability Assessment Considerations
Each lender considers their own criteria in determining the loan amount for a particular borrower. Different factors play a major role in how much they are willing to lend. These factors include your credit score and history, as well as the stability of your income. They also assess your monthly debt service obligations together with your personal living costs.
Some lenders may focus on your monthly debt service payments and carefully assess your total debt load. A lender may reduce the amount they are willing to offer based on the size of your outstanding debt. Furthermore, if the lender knows you’re expecting a baby in the family, or if you’re taking a career break soon, they may limit their loan offer.
How Much Can I Borrow? Detailed Considerations:
- Loan-to-value: Lenders specify different LTV limits for how much they are willing to loan on each type of loan product. Typically, LTV is the percent of home’s value not covered by your deposit. So if you deposit 25% on a home, that would mean the LTV is 75%.
- Pre-tax income: This consists of your basic income, including pension, other earnings from overtime income, workplace bonuses, and sales commissions. It also considers pensions and any financial support you receive from an ex-spouse. Some lenders count overtime income in full, while others may only count it at a reduced rate of 50%. For those who are self-employed, you must provide additional documentation such as bank statements, business accounts, and recent income tax payments. You must show accounts covering 2 to 3 years of your earnings.
- Outgoing Expenses: This is comprised of regular payments you make each month. It includes utilities, transportation expenses, debt service fees on credit cards and other loans, and basic living costs such as recreation and childcare. It also factors in payments for rent, insurance policies, and council taxes. Beyond the headline numbers, some lenders may lower your total limit for each additional child in the family. If your numbers seem off, a lender may ask to see recent bank statements to verify them.
- Anticipated Personal Living Changes: Lenders consider the risk of job loss, illness, and major life changes such as having a child. It also considers changes when you take a career break to pursue further education.
- Anticipated Market Condition Changes: Lenders want to ensure borrowers will still be able to make payments if interest rates rise in-line with typical historical shifts.
The Impact of COVID-19 On the Property Market
In 2020, the COVID-19 pandemic affected every sector of the economy all over the world. The UK Government published a guide on home moving during the coronavirus outbreak.
In October 6, 2020, Prime Minister Boris Johnson announced a 5% mortgage deposit scheme for first-time home owners. With 5% deposit guaranteed by the government, borrowers can access more mortgage products. This provides options for those who cannot not afford a 10% deposit.
The Bank of England (BoE) cut their interest rate to 0.1% as early as March 19, 2020. In spite of the BoE easing policy, many banks have tightened lending standards.
During lockdowns, far fewer homes were sold across the UK. This led to record sales from pent up demand after the initial lockdown ended.
Property website Rightmove, which says it is used by 90% of British estate agents, reported the highest number of home sales agreed since it began tracking the data more than 10 years ago, with transactions more than 20% higher than the previous record.
The above jump in demand was before the UK government announced a stamp duty holiday in July 2020. After the stamp duty holiday was announced, the property market grew hotter with home prices rising 3.7% in August 2020. Property prices have risen more in areas outside of greater London as many people who formerly worked in the city now have the ability to work from home. They sought more home space with lower living costs. The Fair Oaks, Hampshire and Formby, Merseyside markets have been particularly hot.
The stamp duty holiday was originally scheduled until March 31, 2021. But later on, Chancellor Rishi Sunak officially announced that stamp duty holiday is extended until June 30, 2021. Reduced rates were extended once more until September 30, 2021, however the nil rate band was lowered from £500,000 to £250,000.
You can calculate stamp duty across the UK using the government’s free online tool.
Stamp Duty Holiday
During the stamp duty holiday period, the stamp duty tax threshold was originally raised from £125,000 to £500,000 for property sales throughout England and Northern Ireland. Originally only homebuyers considering properties above the £500,00 threshold were required to pay stamp duty. The temporary tax break encouraged more prospective buyers to purchase homes.
In 2021, roughly 9 in 10 buyers are expected to pay no stamp duty at all. The average stamp duty bill is anticipated to decline by £4,500.
English & Northern Ireland Stamp Duty Rates
The following table shows freehold home stamp duties an individual or couple would pay when they purchase their primary residence.
| Location | Property Value | Regular Rate | Initial Discount Rate | July 2021 Rate |
|---|---|---|---|---|
| England | £100,000 | £0 | £0 | £0 |
| England | £200,000 | £1,500 | £0 | £0 |
| England | £300,000 | £5,000 | £0 | £2,500 |
| England | £400,000 | £10,000 | £0 | £7,500 |
| England | £500,000 | £15,000 | £0 | £12,500 |
| England | £600,000 | £20,000 | £5,000 | £17,500 |
| England | £700,000 | £25,000 | £10,000 | £22,500 |
| England | £800,000 | £30,000 | £15,000 | £27,500 |
| England | £900,000 | £35,000 | £20,000 | £32,500 |
| England | £1,000,000 | £43,750 | £28,750 | £41,250 |
| England | £1,100,000 | £53,750 | £38,750 | £48,750 |
| England | £1,200,000 | £63,750 | £48,750 | £56,250 |
| England | £1,300,000 | £73,750 | £58,750 | £63,750 |
| England | £1,400,000 | £83,750 | £68,750 | £71,250 |
The discount percentage rate breakdown was originally:
- £500,000 = 0%
- £500,001-£925,000 = 5% of the amount above £500,000
- £925,001-£1,500,000 = 10% of the amount above £925,000 + £33,750 (5% of £675,000)
- £1,500,001 and up = 12% of amount above £1,500,000 along with £33,750 (5% of £675,000) and £57,500 (10% of £575,000)
After June 30, 2021 the percentage rate shifted to
- £250,000 = 0%
- £250,001-£925,000 = 5% of the amount above £250,000
- £925,001-£1,500,000 = 10% of the amount above £925,000 + £21,250 (5% of £425,000)
- £1,500,001 and up = 12% of amount above £1,500,000 along with £21,250 (5% of £425,000) and £57,500 (10% of £575,000)
Second home buyers can also avail of the discounted rates, though they will also be required to pay an extra 3% stamp duty.
Prior to the COVID-19 crisis, stamp duty was paid on any land or property sold for above £125,000. First-time buyers got an exemption on property valued up to £300,000.
Scotland Land and Buildings Transaction Tax Rates
- £145,001-£250,000 = 2%
- £250,001-£325,000 = 5%
- £325,001-£750,000 = 10%
- £750,001 and up = 12%
Scottish landlords pay an additional 4%.
Scotland ended their discount at the end of March 2021.
Wales Land Transaction Tax
- £180,001-£250,000 = 3.5%
- £250,001-£400,000 = 5%
- £400,001-£750,000 = 7.5%
- £750,001-£1,500,000 = 10%
- £1,500,000 and up = 12%
Welsh landlords pay an additional 3%.
Wales ended their tax discount at the end of June 2021.
Buyers across the UK rushed to take advantage of the stamp duty holiday. Mortgage approvals rose in 2020 ahead of the holiday deadline. According to data from the Bank of England, mortgage approval drastically increased especially after the initial lockdown.
That manic surge has been attributed to a number of components, including eager buyers looking to upgrade their homes to better suit their new lifestyles, which now frequently involve more time at home and remote working.
The following graph illustrates the changing mortgage approval levels in 2020. It includes data from February 2020 to January 2021. Before lockdown was lifted in May 2020, UK mortgage approvals reached as low as 9.3 thousand. However, approvals surged to 40.3 thousand in June 2020 as businesses began reopening. Mortgage approvals reached its peak in November 2020 at 104.9 thousand. This gradually decreased to 98.9 thousand by January 2021.
| Month & Year | No. of UK Mortgage Approvals |
|---|---|
| February 2020 | 73.1 thousand |
| March 2020 | 56.1 thousand |
| April 2020 | 15.9 thousand |
| May 2020 | 9.3 thousand |
| June 2020 | 40.3 thousand |
| July 2020 | 67.6 thousand |
| August 2020 | 86.1 thousand |
| September 2020 | 92.6 thousand |
| October 2020 | 98.3 thousand |
| November 2020 | 104.9 thousand |
| December 2020 | 102.8 thousand |
| January 2021 | 98.9 thousand |
Historical Monthly UK Mortgage Approval Statistics
The following table from the Building Societies Association shows historical UK mortgage data going back to January 1999. From 2010 onward the data reflects all UK mutual lenders. Before 2010 the data reflects the UK building society sector. The August 2009 data does not include Britannia data.
| Period | House Purchase | Remortgaging | Other | Total |
|---|---|---|---|---|
| Jan 1999 | 50,434 | 14,407 | 26,930 | 91,771 |
| Feb 1999 | 78,439 | 28,524 | 36,392 | 143,355 |
| Mar 1999 | 111,482 | 40,438 | 47,717 | 199,637 |
| Apr 1999 | 108,234 | 33,669 | 41,193 | 183,096 |
| May 1999 | 104,691 | 31,698 | 38,526 | 174,915 |
| Jun 1999 | 119,408 | 34,294 | 46,593 | 200,295 |
| Jul 1999 | 113,727 | 33,600 | 44,688 | 192,015 |
| Aug 1999 | 99,052 | 34,444 | 42,735 | 176,231 |
| Sep 1999 | 100,921 | 29,399 | 45,567 | 175,887 |
| Oct 1999 | 99,135 | 31,428 | 42,472 | 173,035 |
| Nov 1999 | 90,985 | 26,076 | 43,719 | 160,780 |
| Dec 1999 | 67,651 | 21,928 | 31,450 | 121,029 |
| Jan 2000 | 50,816 | 22,506 | 27,673 | 100,995 |
| Feb 2000 | 87,861 | 32,344 | 38,425 | 158,630 |
| Mar 2000 | 118,265 | 37,838 | 47,678 | 203,781 |
| Apr 2000 | 99,600 | 33,427 | 37,105 | 170,132 |
| May 2000 | 110,890 | 39,559 | 42,645 | 193,094 |
| Jun 2000 | 115,175 | 39,973 | 55,503 | 210,651 |
| Jul 2000 | 98,182 | 36,042 | 55,498 | 189,722 |
| Aug 2000 | 93,810 | 36,206 | 50,260 | 180,276 |
| Sep 2000 | 92,961 | 35,947 | 45,976 | 174,884 |
| Oct 2000 | 92,562 | 39,214 | 47,913 | 179,689 |
| Nov 2000 | 92,533 | 43,045 | 48,826 | 184,404 |
| Dec 2000 | 70,702 | 37,474 | 41,469 | 149,645 |
| Jan 2001 | 66,306 | 42,715 | 52,350 | 161,371 |
| Feb 2001 | 85,361 | 49,850 | 56,583 | 191,794 |
| Mar 2001 | 120,429 | 68,697 | 70,140 | 259,266 |
| Apr 2001 | 108,794 | 58,821 | 62,581 | 230,196 |
| May 2001 | 128,046 | 66,717 | 68,549 | 263,312 |
| Jun 2001 | 130,888 | 66,706 | 73,230 | 270,824 |
| Jul 2001 | 128,170 | 70,554 | 73,174 | 271,898 |
| Aug 2001 | 118,230 | 60,255 | 72,912 | 251,397 |
| Sep 2001 | 97,882 | 55,778 | 66,764 | 220,424 |
| Oct 2001 | 104,043 | 65,801 | 77,859 | 247,703 |
| Nov 2001 | 99,448 | 72,152 | 76,901 | 248,501 |
| Dec 2001 | 74,184 | 63,927 | 54,722 | 192,833 |
| Jan 2002 | 81,940 | 72,098 | 68,075 | 222,113 |
| Feb 2002 | 108,314 | 73,083 | 71,214 | 252,611 |
| Mar 2002 | 130,848 | 76,175 | 83,401 | 290,424 |
| Apr 2002 | 141,604 | 83,115 | 90,295 | 315,014 |
| May 2002 | 153,080 | 97,438 | 100,321 | 350,839 |
| Jun 2002 | 120,191 | 80,099 | 78,006 | 278,296 |
| Jul 2002 | 139,561 | 94,906 | 97,354 | 331,821 |
| Aug 2002 | 113,903 | 89,028 | 93,297 | 296,228 |
| Sep 2002 | 113,313 | 92,396 | 97,970 | 303,679 |
| Oct 2002 | 126,705 | 106,578 | 110,229 | 343,512 |
| Nov 2002 | 115,388 | 109,832 | 102,659 | 327,879 |
| Dec 2002 | 80,329 | 92,715 | 80,456 | 253,500 |
| Jan 2003 | 73,899 | 91,940 | 94,888 | 260,727 |
| Feb 2003 | 86,255 | 97,212 | 104,014 | 287,481 |
| Mar 2003 | 107,878 | 126,257 | 121,989 | 356,124 |
| Apr 2003 | 110,987 | 132,739 | 109,845 | 353,571 |
| May 2003 | 115,161 | 115,125 | 115,478 | 345,764 |
| Jun 2003 | 124,018 | 115,858 | 122,971 | 362,847 |
| Jul 2003 | 133,549 | 121,018 | 129,156 | 383,723 |
| Aug 2003 | 120,630 | 110,270 | 116,395 | 347,295 |
| Sep 2003 | 131,134 | 123,465 | 125,020 | 379,619 |
| Oct 2003 | 137,731 | 131,176 | 131,649 | 400,556 |
| Nov 2003 | 122,431 | 117,817 | 106,169 | 346,417 |
| Dec 2003 | 99,009 | 96,015 | 85,674 | 280,698 |
| Jan 2004 | 83,620 | 86,969 | 88,908 | 259,497 |
| Feb 2004 | 110,097 | 101,717 | 104,720 | 316,534 |
| Mar 2004 | 148,673 | 128,075 | 123,574 | 400,322 |
| Apr 2004 | 131,047 | 106,883 | 103,424 | 341,354 |
| May 2004 | 132,844 | 103,878 | 101,982 | 338,704 |
| Jun 2004 | 136,507 | 118,847 | 105,376 | 360,730 |
| Jul 2004 | 111,711 | 116,432 | 102,523 | 330,666 |
| Aug 2004 | 93,902 | 105,430 | 95,268 | 294,600 |
| Sep 2004 | 88,803 | 103,326 | 96,568 | 288,697 |
| Oct 2004 | 85,758 | 102,289 | 79,839 | 267,886 |
| Nov 2004 | 74,175 | 92,371 | 78,790 | 245,336 |
| Dec 2004 | 62,708 | 79,831 | 62,053 | 204,592 |
| Jan 2005 | 50,854 | 78,082 | 66,917 | 195,853 |
| Feb 2005 | 73,775 | 89,630 | 77,756 | 241,161 |
| Mar 2005 | 103,905 | 105,234 | 84,032 | 293,171 |
| Apr 2005 | 109,552 | 102,797 | 86,307 | 298,656 |
| May 2005 | 108,051 | 98,038 | 82,253 | 288,342 |
| Jun 2005 | 116,264 | 108,635 | 84,637 | 309,536 |
| Jul 2005 | 106,238 | 108,533 | 76,623 | 291,394 |
| Aug 2005 | 108,360 | 115,761 | 82,955 | 307,076 |
| Sep 2005 | 108,427 | 119,698 | 84,639 | 312,764 |
| Oct 2005 | 107,949 | 117,477 | 78,915 | 304,341 |
| Nov 2005 | 113,898 | 112,403 | 79,263 | 305,564 |
| Dec 2005 | 88,537 | 85,282 | 59,145 | 232,964 |
| Jan 2006 | 77,567 | 81,996 | 69,027 | 228,590 |
| Feb 2006 | 97,161 | 96,494 | 72,829 | 266,484 |
| Mar 2006 | 142,606 | 117,695 | 85,685 | 345,986 |
| Apr 2006 | 109,001 | 88,989 | 68,018 | 266,008 |
| May 2006 | 137,406 | 104,805 | 78,971 | 321,182 |
| Jun 2006 | 146,854 | 108,794 | 84,189 | 339,837 |
| Jul 2006 | 125,734 | 98,525 | 74,867 | 299,126 |
| Aug 2006 | 125,861 | 99,980 | 82,514 | 308,355 |
| Sep 2006 | 125,078 | 96,499 | 78,309 | 299,886 |
| Oct 2006 | 129,442 | 108,850 | 79,583 | 317,875 |
| Nov 2006 | 127,605 | 115,692 | 81,620 | 324,917 |
| Dec 2006 | 82,886 | 78,090 | 54,556 | 215,532 |
| Jan 2007 | 80,232 | 86,974 | 74,900 | 242,106 |
| Feb 2007 | 101,166 | 107,980 | 72,944 | 282,090 |
| Mar 2007 | 133,194 | 112,527 | 81,078 | 326,799 |
| Apr 2007 | 110,529 | 91,654 | 69,601 | 271,784 |
| May 2007 | 136,974 | 117,774 | 79,700 | 334,448 |
| Jun 2007 | 136,433 | 109,251 | 75,191 | 320,875 |
| Jul 2007 | 126,176 | 106,577 | 74,513 | 307,266 |
| Aug 2007 | 114,662 | 99,835 | 69,244 | 283,741 |
| Sep 2007 | 96,955 | 100,781 | 64,945 | 262,681 |
| Oct 2007 | 92,506 | 97,664 | 64,720 | 254,890 |
| Nov 2007 | 80,752 | 97,046 | 61,433 | 239,231 |
| Dec 2007 | 49,891 | 76,272 | 39,388 | 165,551 |
| Jan 2008 | 48,706 | 100,248 | 53,790 | 202,744 |
| Feb 2008 | 63,544 | 109,532 | 61,630 | 234,706 |
| Mar 2008 | 61,861 | 95,179 | 50,918 | 207,958 |
| Apr 2008 | 65,023 | 113,443 | 52,696 | 231,162 |
| May 2008 | 46,711 | 90,656 | 45,670 | 183,037 |
| Jun 2008 | 41,557 | 85,249 | 44,742 | 171,548 |
| Jul 2008 | 38,992 | 76,454 | 47,141 | 162,587 |
| Aug 2008 | 32,075 | 60,798 | 37,951 | 130,824 |
| Sep 2008 | 34,145 | 71,047 | 39,269 | 144,461 |
| Oct 2008 | 34,293 | 79,705 | 35,650 | 149,648 |
| Nov 2008 | 24,752 | 41,171 | 29,076 | 94,999 |
| Dec 2008 | 22,954 | 29,017 | 24,761 | 76,732 |
| Jan 2009 | 21,466 | 26,915 | 30,357 | 78,738 |
| Feb 2009 | 34,597 | 31,631 | 31,857 | 98,085 |
| Mar 2009 | 47,804 | 36,073 | 33,713 | 117,590 |
| Apr 2009 | 48,248 | 32,156 | 27,881 | 108,285 |
| May 2009 | 52,350 | 31,399 | 28,079 | 111,828 |
| Jun 2009 | 61,611 | 36,837 | 32,527 | 130,975 |
| Jul 2009 | 63,317 | 36,810 | 30,722 | 130,849 |
| Aug 2009 | 50,957 | 24,508 | 25,268 | 100,733 |
| Sep 2009 | 59,218 | 26,299 | 30,235 | 115,752 |
| Oct 2009 | 58,818 | 24,653 | 29,523 | 112,994 |
| Nov 2009 | 55,949 | 24,739 | 26,865 | 107,553 |
| Dec 2009 | 42,628 | 23,194 | 20,220 | 86,042 |
| Jan 2010 | 29,721 | 18,941 | 20,029 | 68,691 |
| Feb 2010 | 40,582 | 27,832 | 25,697 | 94,111 |
| Mar 2010 | 57,897 | 33,791 | 30,027 | 121,715 |
| Apr 2010 | 53,602 | 26,540 | 24,744 | 104,886 |
| May 2010 | 53,900 | 26,022 | 23,995 | 103,917 |
| Jun 2010 | 60,422 | 30,042 | 27,512 | 117,976 |
| Jul 2010 | 55,433 | 29,048 | 25,848 | 110,329 |
| Aug 2010 | 47,744 | 26,083 | 24,063 | 97,890 |
| Sep 2010 | 49,573 | 29,638 | 25,361 | 104,572 |
| Oct 2010 | 47,647 | 29,211 | 23,224 | 100,082 |
| Nov 2010 | 47,551 | 36,323 | 22,897 | 106,771 |
| Dec 2010 | 31,095 | 25,756 | 15,237 | 72,088 |
| Jan 2011 | 27,319 | 25,951 | 17,130 | 70,400 |
| Feb 2011 | 40,302 | 37,670 | 20,330 | 98,302 |
| Mar 2011 | 57,095 | 39,692 | 23,701 | 120,488 |
| Apr 2011 | 47,138 | 26,736 | 18,621 | 92,495 |
| May 2011 | 52,450 | 29,179 | 21,018 | 102,647 |
| Jun 2011 | 59,706 | 35,178 | 22,558 | 117,442 |
| Jul 2011 | 55,373 | 32,075 | 20,886 | 108,334 |
| Aug 2011 | 55,564 | 33,224 | 22,435 | 111,223 |
| Sep 2011 | 54,008 | 34,313 | 22,323 | 110,644 |
| Oct 2011 | 52,218 | 33,531 | 20,949 | 106,698 |
| Nov 2011 | 54,644 | 34,198 | 21,539 | 110,381 |
| Dec 2011 | 37,560 | 25,501 | 15,313 | 78,374 |
| Jan 2012 | 37,253 | 26,219 | 16,982 | 80,454 |
| Feb 2012 | 44,968 | 30,140 | 19,575 | 94,683 |
| Mar 2012 | 58,355 | 34,358 | 20,555 | 113,268 |
| Apr 2012 | 51,734 | 29,855 | 17,082 | 98,671 |
| May 2012 | 60,152 | 30,377 | 19,143 | 109,672 |
| Jun 2012 | 51,890 | 24,719 | 16,032 | 92,641 |
| Jul 2012 | 53,880 | 25,906 | 16,639 | 96,425 |
| Aug 2012 | 51,112 | 25,473 | 16,471 | 93,056 |
| Sep 2012 | 48,860 | 28,046 | 15,924 | 92,830 |
| Oct 2012 | 57,420 | 32,126 | 16,480 | 106,026 |
| Nov 2012 | 56,182 | 31,072 | 14,969 | 102,223 |
| Dec 2012 | 38,062 | 22,099 | 10,443 | 70,604 |
| Jan 2013 | 37,248 | 22,575 | 12,360 | 72,183 |
| Feb 2013 | 45,103 | 27,456 | 12,602 | 85,161 |
| Mar 2013 | 55,510 | 31,856 | 13,095 | 100,461 |
| Apr 2013 | 61,829 | 34,170 | 13,433 | 109,432 |
| May 2013 | 68,683 | 33,744 | 14,263 | 116,690 |
| Jun 2013 | 65,188 | 31,757 | 13,355 | 110,300 |
| Jul 2013 | 70,221 | 36,813 | 14,299 | 121,333 |
| Aug 2013 | 64,226 | 34,279 | 13,264 | 111,769 |
| Sep 2013 | 67,172 | 35,683 | 13,041 | 115,896 |
| Oct 2013 | 75,815 | 40,401 | 14,380 | 130,596 |
| Nov 2013 | 71,952 | 36,345 | 13,380 | 121,677 |
| Dec 2013 | 52,657 | 28,338 | 10,218 | 91,213 |
| Jan 2014 | 53,687 | 31,420 | 12,107 | 97,214 |
| Feb 2014 | 60,719 | 32,840 | 12,356 | 105,915 |
| Mar 2014 | 73,356 | 36,687 | 13,134 | 123,177 |
| Apr 2014 | 67,068 | 31,772 | 11,846 | 110,686 |
| May 2014 | 69,277 | 28,633 | 9,365 | 107,275 |
| Jun 2014 | 77,272 | 32,197 | 10,569 | 120,038 |
| Jul 2014 | 77,757 | 36,772 | 12,057 | 126,586 |
| Aug 2014 | 64,137 | 30,448 | 9,581 | 104,166 |
| Sep 2014 | 64,546 | 32,164 | 9,914 | 106,624 |
| Oct 2014 | 66,950 | 35,864 | 10,203 | 113,017 |
| Nov 2014 | 57,897 | 32,725 | 9,117 | 99,739 |
| Dec 2014 | 46,059 | 28,554 | 8,115 | 82,728 |
| Jan 2015 | 41,687 | 26,843 | 7,933 | 76,463 |
| Feb 2015 | 53,841 | 31,580 | 9,145 | 94,566 |
| Mar 2015 | 70,238 | 38,339 | 10,807 | 119,384 |
| Apr 2015 | 70,499 | 36,522 | 10,900 | 117,921 |
| May 2015 | 69,733 | 35,192 | 10,988 | 115,913 |
| Jun 2015 | 81,112 | 39,841 | 12,315 | 133,268 |
| Jul 2015 | 82,731 | 42,761 | 12,422 | 137,914 |
| Aug 2015 | 69,833 | 39,359 | 11,805 | 120,997 |
| Sep 2015 | 74,149 | 43,713 | 13,129 | 130,991 |
| Oct 2015 | 74,580 | 43,720 | 13,104 | 131,404 |
| Nov 2015 | 70,383 | 41,742 | 12,414 | 124,539 |
| Dec 2015 | 54,819 | 36,576 | 10,318 | 101,713 |
| Jan 2016 | 49,700 | 34,301 | 10,254 | 94,255 |
| Feb 2016 | 66,250 | 41,621 | 13,099 | 120,970 |
| Mar 2016 | 77,609 | 45,043 | 14,183 | 136,835 |
| Apr 2016 | 72,660 | 42,985 | 13,855 | 129,500 |
| May 2016 | 74,217 | 43,488 | 13,409 | 131,114 |
| Jun 2016 | 78,557 | 46,852 | 13,737 | 139,146 |
| Jul 2016 | 67,727 | 44,908 | 13,070 | 125,705 |
| Aug 2016 | 64,389 | 42,418 | 13,203 | 120,010 |
| Sep 2016 | 66,905 | 45,700 | 14,447 | 127,052 |
| Oct 2016 | 68,175 | 46,143 | 13,986 | 128,304 |
| Nov 2016 | 71,336 | 50,807 | 14,293 | 136,436 |
| Dec 2016 | 50,460 | 40,601 | 10,693 | 101,754 |
| Jan 2017 | 48,505 | 39,596 | 12,043 | 100,144 |
| Feb 2017 | 61,064 | 42,296 | 13,386 | 116,746 |
| Mar 2017 | 80,339 | 50,382 | 15,820 | 146,541 |
| Apr 2017 | 63,293 | 37,198 | 12,583 | 113,074 |
| May 2017 | 75,135 | 45,351 | 14,750 | 135,236 |
| Jun 2017 | 78,891 | 48,712 | 14,914 | 142,517 |
| Jul 2017 | 73,221 | 48,429 | 15,664 | 137,314 |
| Aug 2017 | 70,491 | 46,889 | 14,575 | 131,955 |
| Sep 2017 | 66,228 | 48,050 | 14,029 | 128,307 |
| Oct 2017 | 67,946 | 56,379 | 14,603 | 138,928 |
| Nov 2017 | 67,872 | 60,137 | 14,793 | 142,802 |
| Dec 2017 | 43,818 | 38,344 | 10,439 | 92,601 |
| Jan 2018 | 49,411 | 43,497 | 12,152 | 105,060 |
| Feb 2018 | 57,019 | 44,109 | 13,160 | 114,288 |
| Mar 2018 | 67,004 | 47,318 | 14,439 | 128,761 |
| Apr 2018 | 66,254 | 46,937 | 13,404 | 126,595 |
| May 2018 | 74,586 | 53,279 | 14,239 | 142,104 |
| Jun 2018 | 76,455 | 49,250 | 15,098 | 140,803 |
| Jul 2018 | 72,160 | 47,952 | 17,167 | 137,279 |
| Aug 2018 | 70,507 | 53,947 | 15,419 | 139,873 |
| Sep 2018 | 62,852 | 47,621 | 14,711 | 125,184 |
| Oct 2018 | 73,674 | 57,038 | 15,521 | 146,233 |
| Nov 2018 | 66,947 | 54,338 | 15,189 | 136,474 |
| Dec 2018 | 44,510 | 38,330 | 9,715 | 92,555 |
| Jan 2019 | 49,669 | 45,125 | 13,521 | 108,315 |
| Feb 2019 | 58,628 | 46,314 | 13,794 | 118,736 |
| Mar 2019 | 67,911 | 52,119 | 15,187 | 135,217 |
| Apr 2019 | 67,368 | 46,907 | 14,059 | 128,334 |
| May 2019 | 75,377 | 47,517 | 15,636 | 138,530 |
| Jun 2019 | 73,651 | 45,745 | 14,670 | 134,066 |
| Jul 2019 | 78,065 | 52,644 | 15,952 | 146,661 |
| Aug 2019 | 67,088 | 48,470 | 14,837 | 130,395 |
| Sep 2019 | 65,176 | 49,953 | 14,880 | 130,009 |
| Oct 2019 | 71,721 | 60,046 | 15,856 | 147,623 |
| Nov 2019 | 65,490 | 51,795 | 13,553 | 130,838 |
| Dec 2019 | 48,501 | 41,238 | 11,021 | 100,760 |
| Jan 2020 | 53,586 | 47,102 | 12,674 | 113,362 |
| Feb 2020 | 66,511 | 51,176 | 14,098 | 131,785 |
| Mar 2020 | 63,148 | 47,160 | 13,122 | 123,430 |
| Apr 2020 | 16,418 | 32,127 | 6,005 | 54,550 |
| May 2020 | 9,922 | 27,261 | 5,619 | 42,802 |
| Jun 2020 | 47,957 | 38,064 | 9,179 | 95,200 |
| Jul 2020 | 78,374 | 39,162 | 11,656 | 129,192 |
| Aug 2020 | 82,115 | 31,182 | 11,269 | 124,566 |
| Sep 2020 | 96,007 | 34,236 | 13,403 | 143,646 |
| Oct 2020 | 104,806 | 37,220 | 13,587 | 155,613 |
| Nov 2020 | 104,053 | 38,343 | 12,699 | 155,095 |
| Dec 2020 | 78,093 | 30,071 | 11,691 | 119,855 |
| Jan 2021 | 69,312 | 27,694 | 11,303 | 108,309 |
Though there is a gradual decrease in house purchases from November 2020 to January 2021, it should not be a cause for alarm. As shown in the above graph from the Bank of England, the surge in mortgage approvals in the middle of the COVID-19 crisis does not demonstrate normal historical market activity and is near the levels seen in the housing bubble peak before the 2008 global financial crisis. The surge was a catch up for demand which could not be satisfied early in lockdowns along with buyers responding to falling interest rates and new needs in a work-from-home economy. A new mortgage guarantee scheme lasting through the end of 2022 provides a guarantee to mortgage lenders across the UK for borrowers who put a 5% deposit on homes up to £600,000.
The decrease should be seen as the beginning of market normalising after the COVID-19 housing boom. Despite the crisis, affected lenders are encouraged by more market activity as they regain confidence in extending credit and central banks have promised loose monetary policies for years to come. When normal housing demand resumes, the mortgage industry should eventually process applications again more inline with regular historical levels seen from the 2014 to 2019 time-frame.
While the above graph breaks down house purchases versus remortgaging activity, the following graph from the Financial Conduct Authority shows a more detailed look at the market composition of home buyers. Falling rates gave buyers with tracking rates less incentive to refinance as their loan already tracks rates lower. Increasing home prices from easy loan conditions and relaxed stamp duties for people buying their primary residence gave buy-to-let investors reason to pause and first-time home-buyers reason to enter the market. Homeowners working from home who needed a larger space and those looking to move away from urban area lockdowns had incentive to move to larger properties in the countryside, causing home movers to spike as well.
Structural Mortgage Market Shifts: Increasing Loan Duration & Explicit Government Backing
While the stamp duty holiday was widely discussed, the UK also pushed through other structural shifts to the mortgage market in the wake of the COVID-19 crisis.
"In the UK, usually the longest term fixed mortgage you could normally get was five years. Boris Johnson has now created a 25 year fixed mortgage for first-time buyers, offered by banks, guaranteed by the government. Nobody can pretend that this has anything to do with Covid, and in fact when Johnson announced it, his stated aim was to give young people access onto the housing ladder. This is a good example of how the magic money tree was discovered for Purpose A, i.e. Covid, and is being used for Purpose B, furthering social justice." - Russell Napier
When governments guarantee loans they lower the risk of making the loans, which in turn increases the flow of capital into the associated market. That typically leads to faster appreciation.
Programs created to "help" people get into the market are initially effective, but after prices adjust to reflect said capital shifts and risk-free profits the market becomes structurally dependent on such programs & the incremental help they offer declines as prices rise.
The property market has been frenzied throughout the first half of 2021 with Rightmove stating the first half of the year has been the busiest since 2000. Average home prices across England, Wales and Scotland rose to £338,447, an increase of £21,389 or 6.7% since the end of 2020.
The High Cost of Quick Decisions
Between 2015 and 2016, nearly one in three UK consumers chose mortgage products which cost them more than £550 per year. They got more expensive options over cheaper alternatives that were readily available and which they also qualified for. This fee difference amounts to 12.7% of what consumers spend annually on their mortgage.
The remortgage market is more competitive amongst lenders than the first-time buyer (FTB) market. So only around 12% in that category opted for strongly dominated product choices. About 18% of first-time buyers fall into the strongly dominated product choice category, and well over 20% of mover mortgages fall in this category. Movers who are in a rush often make emotionally driven or time-sensitive decisions. This compromises their ability to obtain the best deal the way a person who is remortgaging can.
About 14% of borrowers in the top credit score quartile secured strongly dominated products, while more than 20% of consumers in the bottom quartile did not. In general, people who are young, including borrowers with low incomes, low credit scores, and limited funds for deposit are more likely to get an unfavourable mortgage deal. If there are factors that make your transaction more complex, you might find it more challenging to obtain a good loan.
Due to the large price difference between loan products, around 70% of borrowers seek independent intermediaries to help them compare loans. Instead of going directly to a lender, they usually get a broker for help in finding and comparing loans. When comparing loans, it’s best to look at the total loan coast in Annual Percentage Rate (APR) rather than the interest rate in isolation. The former gives you a multidimensional view which incorporates the full cost of financing inclusive of arrangement, valuation and survey fees, along with any other expenses.
How Much Can You Afford to Borrow?
Lenders generally prefer borrowers that offer a significant deposit. They typically request at least 5% deposit based on the value of the property. If a house is valued at £180,000, a lender would expect a £9,000 deposit. In this example, the lender would be willing to offer a loan amount of £171,000. Meanwhile, some lenders may offer first-time buyers a 100% mortgage with a £0 deposit. However, obtaining this sort of deal usually forces a borrower to pay a much higher interest rate on their loan. This is usually one percent higher than a mortgage that requires a deposit. Consider this expensive trade-off before choosing a zero-deposit deal.
If you know the interest rate you’ll be charged on a loan, you can easily use the above calculator to estimate how much home you can afford. For example, at 2.29% APR on a £180,000 home loan, it will require £788.61 of full repayment per month, or £343.50 per month with an interest-only payment. If your maximum monthly budget for a home payment is £1,000 per month, you would then divide this amount by the above payments to get the equivalent loan capital. The example is shown in the table below.
Default Calculation
| Loan Type | Loan Amount | Interest Rate | Monthly Payment |
|---|---|---|---|
| Interest-only | £180,000 | 2.29% APR | £343.50 |
| Fully Amortising | £180,000 | 2.29% APR | £788.61 |
New Calculation
| Loan Type | Interest-only | Full Repayment |
|---|---|---|
| Monthly Payment | £1,000 | £1,000 |
| Old Monthly Payment | £343.50 | £788.61 |
| Payment Conversion | £1,000 / £343.50 = 2.9112 | £1,000 / £788.61 = 1.2681 |
| Old Loan Amount | £180,000 | £180,000 |
| New Loan Amount | £180,000 * 2.9112 = £524,016 | £180,000 * 1.2681 = £228,258 |
| Home Value at 95% LTV | £524,016 / 0.95 = £551,596 | £228,258 / 0.95 = £240,272 |
| 5% Deposit | £551,596 – £524,016 = £27,580 | £240,272 – £228,258 = £12,014 |
The above calculations consider the capital and interest portion of the mortgage payment, but do not cover other aspects of home ownership. If your property taxes cost £1,200 per year, that would be £100 per month. You would need to subtract that and any other expenses. This includes costs such as insurance or common dwelling fees before calculating the remaining capital and interest portion of your monthly payment.
If you had £200 in other monthly home ownership related fees, then this might take a renter equivalent of £1,000 down to £800.
Also, if you had a different interest rate on the offer, then you would need to use that interest rate in your calculations versus what our calculator shows as a default.
Want to Pay Your Loan Off Quicker?

With strong property prices, it’s not uncommon for people to take out loans extending beyond 25 years. However, with the rise of technology and automation, who knows what the world would look like in a quarter century? Paying extra on your home means your balance is lower today AND your balance is lower tomorrow. The earlier you make mortgage overpayments, the more interest expense you will save.
Making early overpayments reduces your balance for the duration of the loan. Just take note of early repayment charges (ERC). Some lenders allow you to overpay up to a certain amount before prompting early repayment penalty fees. These fees can range between 1% to 5% of your loan amount. Be sure to make qualified overpayments to avoid this extra cost.
Suppose you want to pay off your loan in 15 years. Your original mortgage has with a 25-year term. To estimate the overpayment amount you need to make, adjust the above calculator to 15 years. For example, a £180,000 loan structured over 25 years will see you pay £56,581.78 in interest over the life of the mortgage. However, if you pay off the loan within 15 years, your monthly payment would jump from £788.61 to £1,182.51. See the example in the table below.
Loan Amount: £180,000
Interest Rate: 2.29% APR
| Pay-off time | 25-years | 15-years |
|---|---|---|
| Monthly Payment | £788.61 | £1,182.51 |
| Total Interest Expenses | £56,581.78 | £32,851.43 |
This example presumes you are able to maintain the same APR when you remortgage. Though your monthly payment increased, your total interest expenses would decrease to £32,851.43. This saves you a total of £23,730.35 over the life of the loan. Consider making overpayments to boost your interest savings.
How Do You Compare Loan Offers?
In any loan scenario, you have to make underlying assumptions such as:
- If you are likely to remortgage the loan again.
- When you are likely to remortgage.
- Where you think interest rates are headed.
- If you think you will sell the home soon.
- If rates head higher and your rate resets well above the initial offer, will your wages be enough to cover payments?
Look Beyond the Monthly Payment
It’s important to consider the overall mortgage costs, not just the monthly payment amount. Borrowers will find interest-only payments affordable. However, compared to a full repayment mortgage, you immediately build equity in your home. This bring you closer to home ownership, stability, and grants you further life flexibility. In contrast, interest-only payments do not build equity. It does not provide financial cushion which helps protect you against shifting market conditions.
If one loan amortises and the other does not, then you have to look at how much equity you build in a home. This is a key factor in determining value. Most people also do not want to pay mortgages for the entire lifetime, or until they hit a tough patch and risk foreclosure.
Example Loan Comparison from a Reader
The key to being able to accurately compare mortgage offers is to only adjust a single variable at a time. This way you can easily see the differences between offers, instead of trying to compare apples to oranges.
So if you know you want a 2-year introductory term on a 12-year amortisation schedule, you can compare all loans on offer that fit those criteria. This allows you to focus on comparing the difference in interest rate and total interest paid against the upfront fee for buying access to a lower rate.
The example below is based on a question from one of our users named Dan.
Useful information on your website. Your calcs suggest that more capital is paid than interest in the first year and going forward. However I have seen sites which suggest the opposite is true and I have to say my recollection was this this was the way it tended to work. What I am trying to work out is when I reduce my term from 20 years to 12 years whether I am better to go with 1.12% or 1.54% 2 year fixed. As the former has a fee involved I am trying to see how much capital I will have reduced over the 2 years to see if while the 1.54 is offer I will have reduced less of the loan when I look for another 2deal in 2 years (i.e. some of the monthly payment will have been paying interest rather than repaying capital borrowed.
Answer: The ratio of interest vs. capital repayment depends on both the interest rate AND the length of the loan.
- A longer loan term means a relatively larger share of early payments go toward interest instead of paying on capital (hence the term lasts longer).
- A higher rate has the same sort of function of increasing the share of the early payment that is applied toward interest.
- When interest rates are relatively high (e.g. 5% or 6%) then initial payments on a 25-year loan term go mostly toward interest. If rates are low like they currently are, then the opposite is true.
- Set the interest rate really high (say like 10%) while changing nothing else and you’ll see how dramatically it can change the capital allocation and payments.
Example loan scenarios below:
12-Year Fixed £200,000 @ 1.54%, Remortgaging 2 Years In
| Year | Interest | Capital | Balance |
|---|---|---|---|
| 1 | £2,972.36 | £15,292.37 | £184,707.63 |
| 2 | £2,735.19 | £15,529.54 | £169,178.08 |
| Total | £5,707.55 | £30,821.91 | £169,178.08 |
12-Year Fixed £200,000 @ 1.12%, Remortgaging 2 Years In
| Year | Interest | Capital | Balance |
|---|---|---|---|
| 1 | £2,159.78 | £15,659.74 | £184,340.26 |
| 2 | £1,983.48 | £15,836.03 | £168,504.24 |
| Total | £4,133.26 | £31,495.77 | £168,504.24 |
Presuming the loan terms are similar and you will remortgage in a couple of years, the ending balances should be quite similar. In the above examples the loan with a higher interest rate had a £673.84 higher balance. This is one of the two numbers you will need to look at.
What you really have to compare is the interest amount paid if you know you will remortgage in 2 years.
The difference in interest paid is £1,574.29 (£5,707.55 – £4,133.26). Add that amount to the balance difference and you get £2,248.13.
If this amount is more than the upfront fee, then you save money by paying the upfront fee for buying the lower rate.
To run the numbers again, let’s say that upfront fee is £1,200 and you roll it into the loan.
12-Year Fixed £201,200 @ 1.12%, Remortgaging 2 Years In
| Year | Interest | Capital | Balance |
|---|---|---|---|
| 1 | £2,172.73 | £15,753.69 | £185,446.31 |
| 2 | £1,995.38 | £15,931.04 | £169,515.26 |
| Total | £4,168.11 | £31,684.73 | £169,515.26 |
Financing the fee costs more than paying it upfront. But it can still be a viable option if there is a significant interest rate difference relative to the upfront cost. Even if you financed the loan fee, in the above scenario, you still come out ahead when compared against the higher rate.
By rolling the fees into the loan, you pay an extra £34.85 in interest over the first 2 years. Your balance at the end of the first 2 years is £11.02 higher than if you kept your current loan.
Your remaining loan balance being £11.02 higher is certainly worth the £1,539.44 saved on monthly interest payments over the course of those 2 years.
Only Compare a Single Variable at a Time
The trick with comparing loan offers is to decide what you want to keep the same (e.g. loan term). Then only compare loans with one difference at a time so it is easy to make an A vs. B comparison.
If you compare loans with different terms, rates, fees, caps and so on side by side, it can almost be impossible to make the best choice. Too many variables makes it difficult to decide.
A lot of people pick whatever the lower initial monthly payment is without considering how payments may change, what the fees are, etc.
In the above A vs. B example comparison, the fee for buying the lower rate was not rolled into the loan. If you are going to roll that fee into the loan, then you would do that same sort of comparison again. But you run the second calculation using the fee as part of the loan amount.
Projecting the Past Into the Future
We tend to presume the future will be a continuation of the recent past, though the year 2020 has shown this to not be true.
One last note of caution. Since the early 1980s, the world has seen falling interest rates as globalisation and technology have been massive deflationary forces driving down the cost of labour, logistics, and goods. Long-term interest rate cycles in developed economies often last for around 70 to 100 years. We are likely approaching a turning point sometime in the next couple of years. So when you go to remortgage again, rates may be moving higher already.
Central banks have been having interest rates pegged at the lower bound, and some even employ negative interest rates. As fiscal intervention picks up, rates are likely to head higher eventually. In fact, early on in the COVID-19 crisis, the Federal Bank of New York’s Kenneth D. Garbade authored a report on yield curve control measure that were used during and after World War II.
Paying for a longer fixed period can seem like a waste of money so long as interest rates keep falling. But when they start moving in the other direction, rising rates can have a dramatic impact on your monthly budget. You’ll have to get ready for more expensive payments.
I hope this helps you, Dan!
Arrears & Foreclosures
You are obligated to regularly pay your mortgage. If you fall behind on payments, the lender may seize your home.
1.27% of total loans were in arrears at the end of the fourth quarter of 2020.
In the fourth quarter of 2020, lenders took new position of 435 units, while selling off 983 units, leaving an ending stock of 1,933 units.
Equity Release Mortgages
Rising longevity coupled with increasing living costs have forced many elderly citizens to use their home equity. They tap it to pay for living costs or pay expenses for their own parents or children. Stamp duty fees and the hassle of moving makes equity release relatively appealing compared to the cost of downsizing.
People aged 55 years old and above use one of two types of loans to leverage on the equity they've built:
- Lifetime Mortgages: The homeowner can receive a lump sum or draw down equity over time. When the dwelling is sold, the homeowner can then repay the accrued interest owed along with the original amount borrowed.
- Home Reversion Plans: All or part of the home’s equity is sold upfront at a discount with the person receiving either a monthly payment or a lump sum. When the house is sold, proceeds of the sale are split according to the share of ownership by each part.
Of the two options, the lifetime mortgage option is far more popular with consumers.
Thank you!
Please come again. You may want to bookmark our site for future reference. :)
If you can help spread the word on social media, that would mean a lot to us.
Free Mortgage Calculator Widgets for Your Website
Many of our website visitors have asked us if they can syndicate our calculator on other websites. The answer is yes. :)
Click here to see our full line of mortgage calculator embed options.
Reference Resources
- Mortgage lending statistics: Financial Conduct Authority, 2021
- Mortgage Lenders and Administrators Statistics: 2020 Q4: Bank of England
- Iscenko, Zanna. Choices of dominated mortgage products by UK Consumers: Financial Conduct Authority, 2018
- Miles, David. The UK Mortgage Market: Taking a Longer-Term View: HM Treasury, 2004.
- Miles, David. Incentives Information and Efficiency in the UK Mortgage Market: The Economic Journal, Vol. 115, No. 502, Conference Papers (Mar., 2005), pp. C82-C98
- Mohammad Jamei. Mortgage Market Forecast: 2018 and 2019: UK Finance, 2017.
- Mortgage industry of the United Kingdom: Wikipedia
Check Out All of Our Free Online Calculators
Widgets | Affordability | Amortisation | Overpayment | Remortgage | About
Do you have feedback or questions? Email us
© 2019 — 2024 MortgageCalculator.UK — All Rights Reserved